Automated Cytometry Data Analysis with Actionable Insights.
terraFlow is a cloud-based platform for automated flow cytometry analysis and literature mapping.

Our platform analyzes every possible phenotype in your cytometry dataset using machine learning and expert-informed models—no coding, software, or bioinformatics team required. Just upload your FCS files and get a detailed, publication-ready report in 24 hours, with clear phenotypes and key findings contextualized and linked directly to primary literature.
Upload & Label
Upload your FCS files, label your sample groups, confirm your gating, and hit submit. Our secure, user-friendly interface makes starting your analysis effortless.
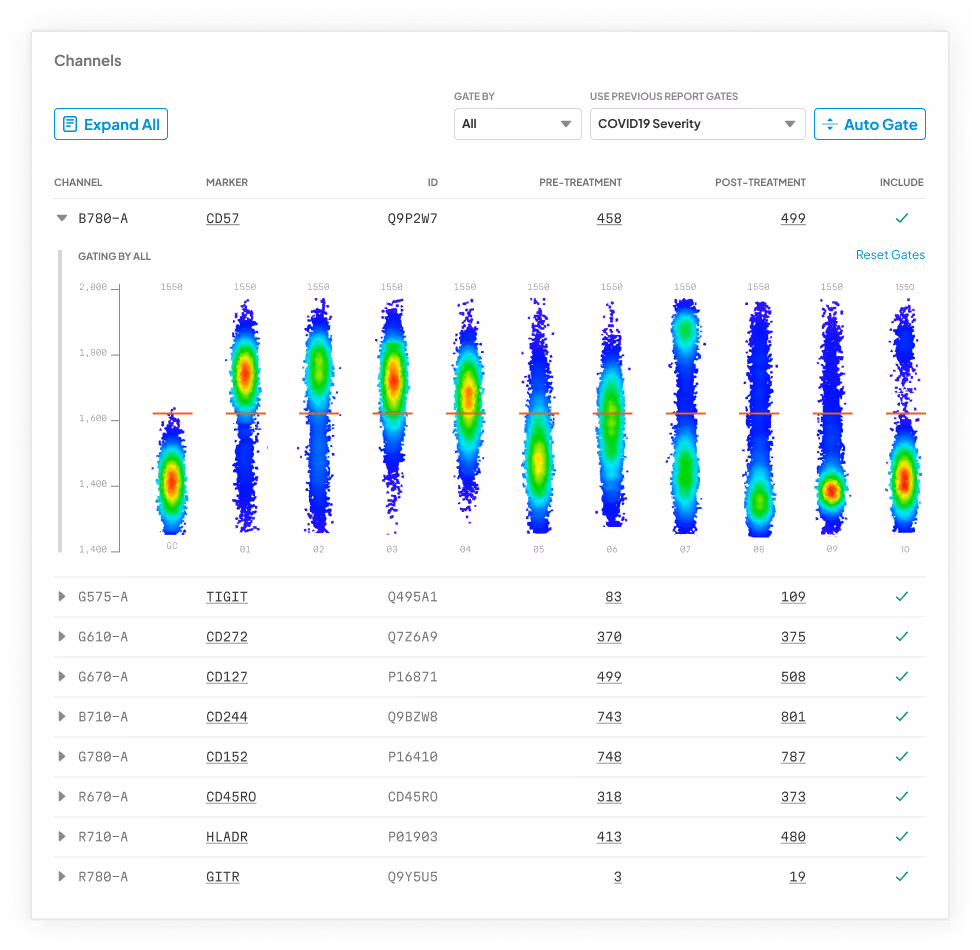
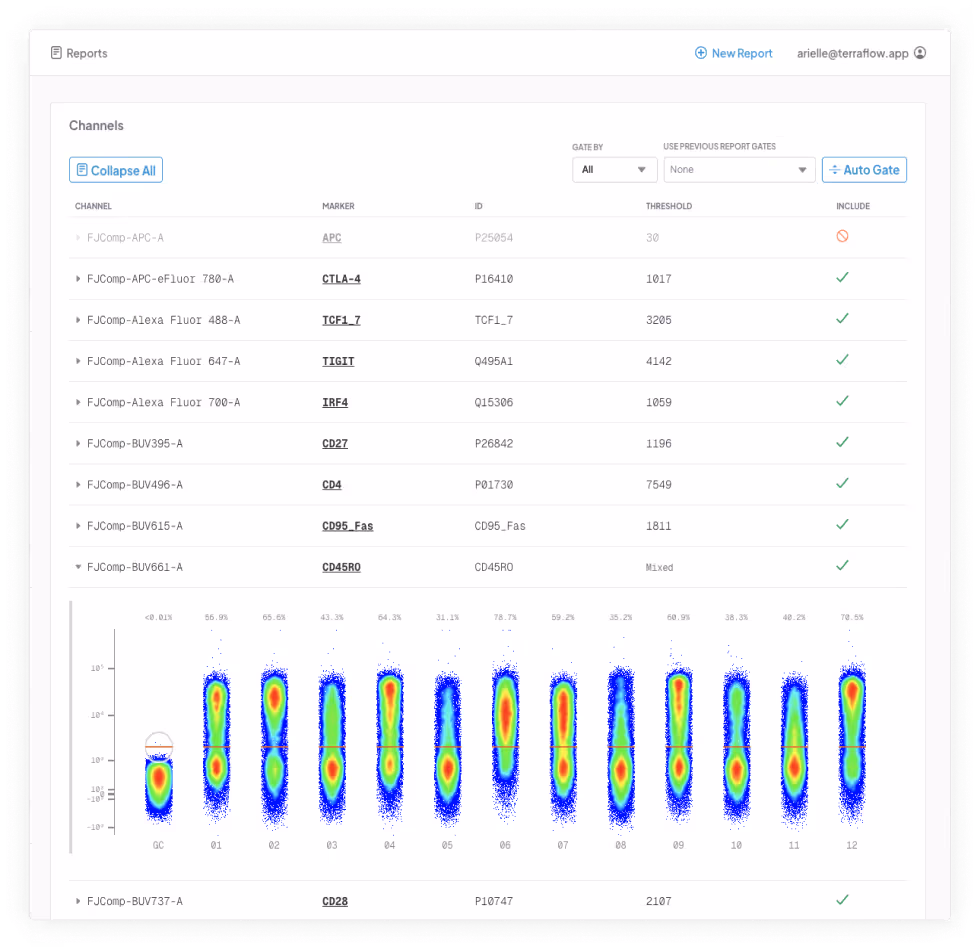
Explore & Analyze
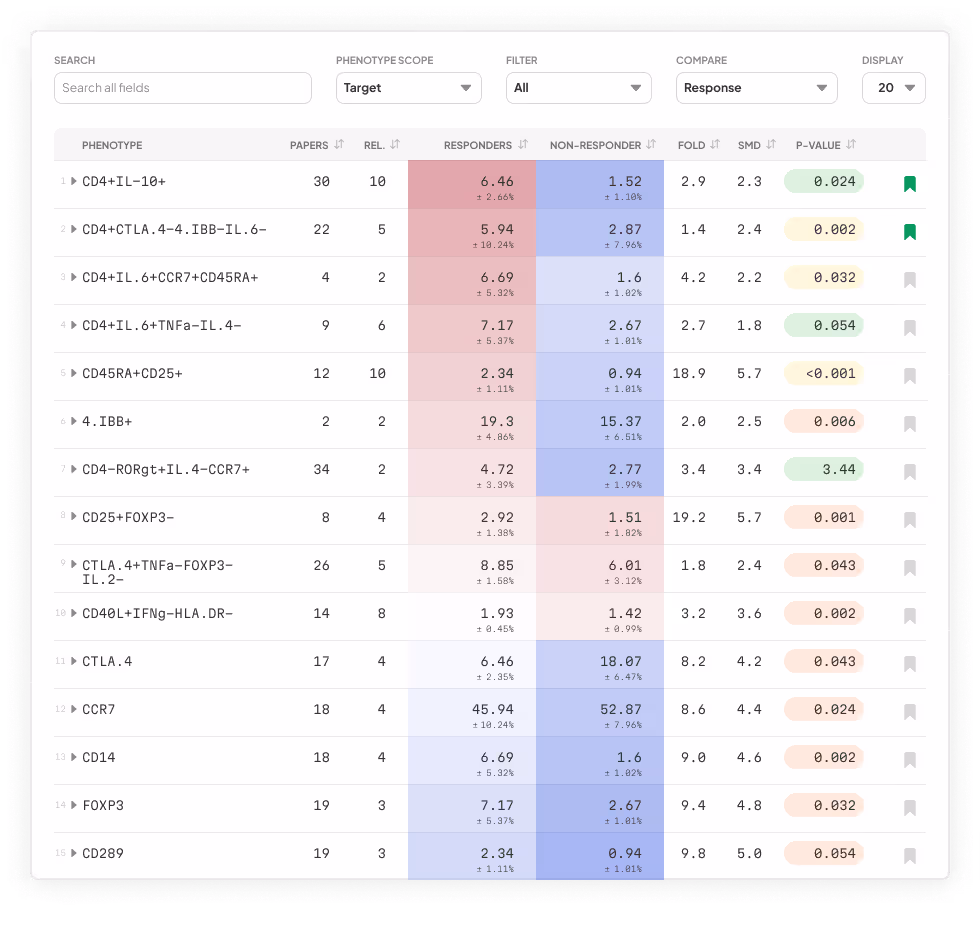
terraFlow performs a complete and unbiased cellular profiling of your data. We automatically gate every possible phenotype, including rare subtypes, and use statistical analysis to highlight the key differences between your sample groups – all within 24 hours.
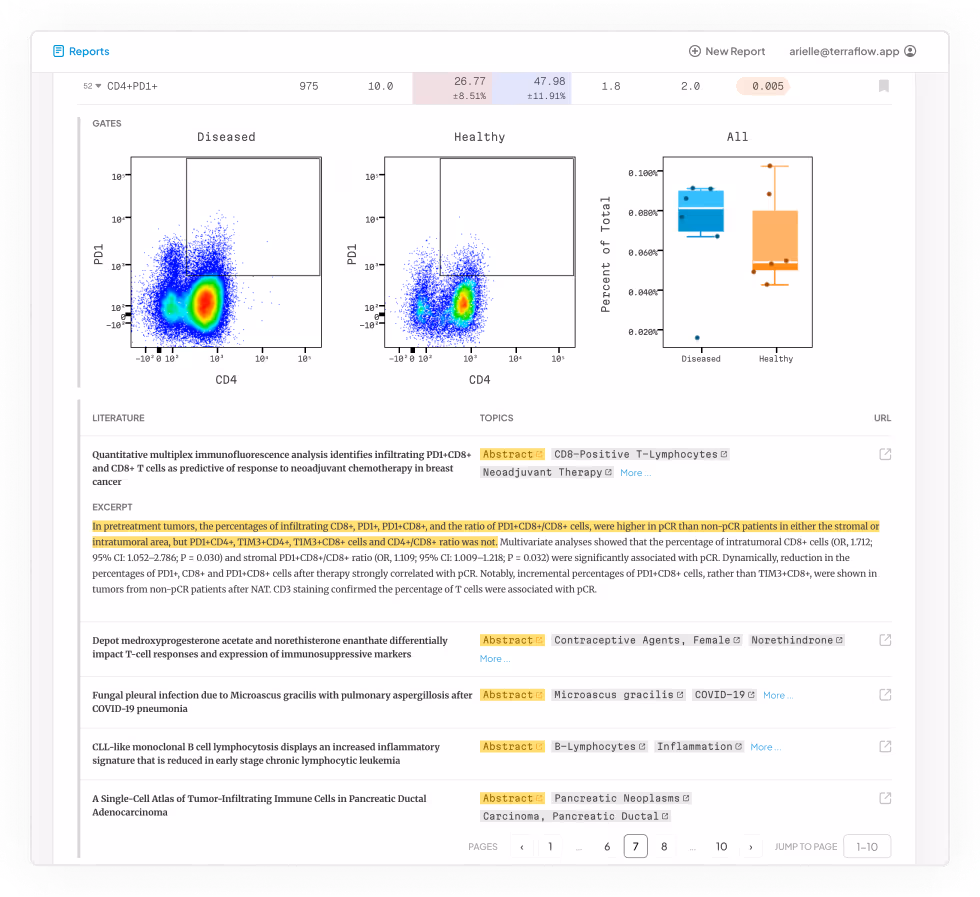
Report & Contextualize
We place your results into scientific context by comparing them with over a million publications, delivering clear and actionable insights. Your final report includes presentation-ready graphs and visualizations, ready to download and share.
Trusted by Industry Leaders

“terraFlow makes the process of analyzing data easier and more consistent, and it gives full immunophenotyping reports within 24 hours. This helps investigators working with high-dimensional panels make decisions faster and with more choices.”
terraFlow in Action
Let us help you find every immune signature in your data and deliver clear, specific, replicable phenotypes—every time.
Book a Demo

We are SOC 2 Type II Certified
- Security: Robust protection against unauthorized access and cyber threats.
- Availability: Reliable uptime and service continuity you can count on.
- Processing Integrity: Accurate, timely, and authorized data processing.
- Confidentiality: Strong safeguards for your sensitive and confidential data.
- Privacy: Responsible handling and protection of your personal information.